
Login

Shoutbox
You must login to post a message.
allenb
09/07/2024 10:25 AM
1trakmind 
renatoa
09/06/2024 9:41 AM
 , n0n4m3
renatoa
09/05/2024 2:35 AM
GabiZ and pawantanwar, 
renatoa
09/02/2024 6:15 AM
 , robair
allenb
09/01/2024 3:51 PM
clarkwisconsin
Forum Threads
Newest Threads
My Sight Glass FB Ro...Guatemala Acetenango...
Green coffee reviews
Air vs Drum roaster
War on Farmers by Su...
Hottest Threads
| Skywalker, the AL... | [263] |
| War on Farmers by... | [53] |
| Green coffee reviews | [10] |
| Help and recommen... | [10] |
In Memory Of Ginny

Donations
Latest Donations
dmccallum - 10.00
JackH - 25.00
snwcmpr - 10.00
Anonymous - 2.00
Anonymous - 5.00
dmccallum - 10.00
JackH - 25.00
snwcmpr - 10.00
Anonymous - 2.00
Anonymous - 5.00
Users Online
Guests Online: 7
Members Online: 0
Total Members: 8,478
Newest Member: 1trakmind
Members Online: 0
Total Members: 8,478
Newest Member: 1trakmind
View Thread
Who is here? 1 guest(s)
 Wonky ROR in Artisan when logging roasts
|
|
| roastedgourd |
Posted on 06/17/2015 3:55 PM
|
 Newbie  Posts: 33 Joined: December 01, 2012 |
I'm having trouble getting an accurate reading of BT ROR during roasting. I'm using a solid drum Huky with the Center 301 datalogger plugged into Artisan. During the roast, the ROR curve on the screen fluctuates wildly, with seemingly no rhyme or reason to its gyrations. The actual BT reading is nice and smooth, following the expected trajectory. After I end the roast session, however, the ROR curve smooths right out and follows the expected curve. I'm running Artisan 9.3. I assume I'm just missing a setting, but I can't figure it out. Any ideas?
-Ian
|
|
|
|
| ginny |
Posted on 06/17/2015 4:35 PM
|
 Founder Posts: 3476 Joined: October 24, 2005 |
Quote the ROR curve smooths right out and follows the expected curve maybe your beans are just what it expects. hardware/software/add ons... what are you using here. -g |
|
|
|
| roastedgourd |
Posted on 06/17/2015 5:46 PM
|
|
Newbie Posts: 33 Joined: December 01, 2012 |
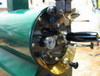
Not sure I follow... I listed my setup above, but here's a more concise list: Huky 500 Stock type k thermocouple for BT Center 301 data logger with usb connection to Artisan v9.3 for windows What am I missing? -Ian
|
|
|
|
| ginny |
Posted on 06/17/2015 7:49 PM
|
|
Founder Posts: 3476 Joined: October 24, 2005 |
Ian, seems like I missed the info in your initial post but not sure if it makes a difference since I do not know what you are roasting. it does make a difference. let us know. ginny |
|
|
|
| allenb |
Posted on 06/17/2015 10:00 PM
|
 Administrator Posts: 3884 Joined: February 23, 2010 |
Ginny, bean temp is tracking fine. His issue has to do with the way Artisan is displaying RoR on the graph during the roast and doesn't have anything to do with the way his roast and the real RoR is progressing. I'm guessing it's as he is suspecting and is most likely a sampling time issue that needs to be adjusted in Artisan. Allen 1/2 lb and 1 lb drum, Siemens Sirocco fluidbed, presspot, chemex, cajun biggin brewer from the backwoods of Louisiana
|
|
|
|
| ginny |
Posted on 06/18/2015 6:23 AM
|
|
Founder Posts: 3476 Joined: October 24, 2005 |
oh, ok guess I could not read the chart well either... back t bed for me. -g  |
|
|
|
| JackH |
Posted on 06/18/2015 7:08 AM
|
 Administrator Posts: 1809 Joined: May 10, 2011 |
I am not familiar with the Artisan application, but I found this post that may help with smoothing the Ror curve in Artisan: http://forum.home...post_48758 Edited by JackH on 06/18/2015 8:28 AM ---Jack
KKTO Roaster. |
|
|
|
| roastedgourd |
Posted on 06/18/2015 8:09 PM
|
|
Newbie Posts: 33 Joined: December 01, 2012 |
Thanks folks. I made some progress by piecing together info from several different sources. Curves are looking better.
-Ian
|
|
|
|
| allenb |
Posted on 06/18/2015 8:19 PM
|
|
Administrator Posts: 3884 Joined: February 23, 2010 |
That's good news! Please let us know what you did to improve it. Allen 1/2 lb and 1 lb drum, Siemens Sirocco fluidbed, presspot, chemex, cajun biggin brewer from the backwoods of Louisiana
|
|
|
|
| roastedgourd |
Posted on 06/18/2015 8:33 PM
|
|
Newbie Posts: 33 Joined: December 01, 2012 |
I set the sampling rate to 3 seconds instead of 2 and enabled oversampling. I tried adjusting smoothing, but it seems to only adjust the curve postroast. It seems that the issue (if I understand it correctly) is that the probe is subject to picking up lots of "noise" which is expressed as seemingly wild fluctuations in temperature on the ROR graph during the roast. After the roast, the curve is averaged out and smoothing can take place, which enables a more helpful curve. While it's not perfect, and sampling every 3 seconds allows more to happen in the roast than I'd prefer, I think once I get used to it, I'll be able to do what I want to. It's entirely possible that I'm still missing something that could make it better, so if there are any Artisan users out there, I'd still love your input. I've used Cropster and Roastlog and neither one of those platforms have this issue, so I know it can be done, but perhaps you get what you pay for. 
-Ian
|
|
|
|
| MaKoMo |
Posted on 06/19/2015 1:29 AM
|
|
1/4 Pounder  Posts: 127 Joined: April 06, 2011 |
You get what you contribute too! Artisan implements two different smoothing algorithms. One is applied during recording that cannot know the future and the other one is applied in all other cases. The issue of not knowing the future is that there is no algorithm on this planet that does not has the negative effect to introduce a delay/shift of the signal (without knowing that future). Both algorithms can be configured under menu Tools >> Extras. "Smooth Curves" for the temperature curves, "Smooth Deltas" for the delta curves. Note that smoothing of the temperature curve does improve the smoothness of the delta curves as those are computed from the temperature data. Note further, that during recording there is no smoothing applied to the temperature curve, but only to the delta curves. Due to the (negative) effect on quantification (the time signal has usually a way higher resolution than the temperature ones), an increase of the time interval (which results in an "increased" resolution of the temperature signal) the RoR is computed from has a positive effect on the smoothness. So larger sampling intervals or an increase of the "Delta Span" the RoR computation is based on has a positive effect. However, one has always to balance. Filtering always results in information loss (by theory) and in the "not-knowing-the-future" case even in a shift in time. The more filtering the higher that effect. I argued somewhere else that all this filtering in software should only be applied as last resort. It is way better to minimize the noise on the measuring system in the first place. This can be done by all kind of methods, but one is to use larger probes that react slower. Those act as a kind of physical filter very early (and therefore very effective) on in the measuring chain. So using very thin probes to reach this high reactivity that I some times read is to me completely nonsense. Also the trend to run for close-to real-time sampling intervals does not make much sense to me for a process like roasting where those 3sec +- do not make any difference considering the hugh delay the thermal mass of those machines anyhow have. Anyhow, if you need further support please choose one of the commercial roast-logging options Marko |
|
|
|
| Turingalad |
Posted on 06/23/2015 9:04 PM
|
 Newbie Posts: 30 Joined: November 18, 2014 |
What does "Config > Oversampling" do? (Dumb question) what are Delta ET/BT? Are they just other options for datalogging from a 3rd and 4th probe? I'm a newb Artisan user. I wish I had the $$ to burn through a sack of beans figuring out how to use the software. :-P |
|
|
|
| rgrosz78 |
Posted on 06/23/2015 9:38 PM
|
 1/4 Pounder Posts: 78 Joined: October 25, 2010 |
Quote Turingalad wrote: What does "Config > Oversampling" do? (Dumb question) what are Delta ET/BT? Are they just other options for datalogging from a 3rd and 4th probe? Not sure about Config > Oversampling. The Deltas are NOT for additional thermocouples. Delta ET shows the change over time in the reading from the ET thermocouple. Delta BT shows the change over time in the reading from the BT thermocouple. Life is too short to drink bad wine ... or bad coffee!
|
|
|
|

| Jump to Forum: |
Powered by PHP-Fusion Copyright © 2024 PHP-Fusion Inc
Released as free software without warranties under GNU Affero GPL v3
Designed with ♥ by NetriXHosted by skpacman